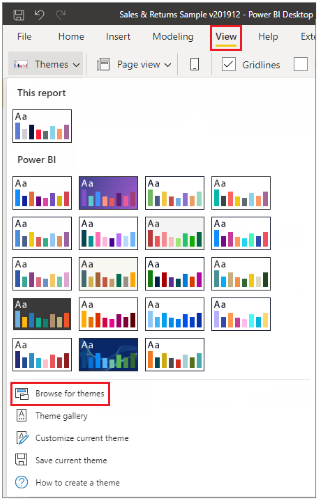
Power BI offers many standard color themes for you to choose from. When working on a dashboard for SIMS, or if you are in an IFRC operation, it is preferable to use a theme that is consistent with IFRC Brand Guidelines. Dashboards may be presented on the GO Platform for an operation, and having consistent theming will maintain design integrity and create a more seamless user experience.
Step by Step

- Download this JSON file.
- In your Power BI Desktop, select the View ribbon, then from the Themes drop down button, select Browse for Themes.
- A window appears that lets you browse to the location of the JSON theme file. Select the JSON file that you saved to your computer.
- When the theme file has loaded successfully, Power BI Desktop displays a success message. When you go to the Visualizations Formatting panel now, the color palette that appears will be the IFRC standard color palette.
- You may have to make some tweaks to the visualizations to optimize their appearance. For example, you should check to see if:
- Colors that are too similar appear next to each other
- Bright colors are drawing your eye to the most important data points; if not, change the colors in the Visualizations Formatting panel so that normal data points are in neutral colors and bright colors are reserved for the data points where you want the viewer to focus.
- Font sizes are large enough to be legible on your visualizations.
Notes on Custom PowerBI Themes in JSON
This report theme JSON file has the following lines:
- name: The report theme name. This field is the only required field.
- dataColors: The list of color hexadecimal codes to use for data in Power BI Desktop visuals. This list can have as many or as few colors as you want.
- background, foreground, and tableAccent (etc.): Color classes. Color classes enable you to set many structural colors in your report at once.
You can use this JSON file as a basis to create your own custom report theme file to import. If you want to adjust only the basic colors of your report, change the name and hex codes in the file.
In a report theme JSON file, you define only the formatting that you want to change. Whatever you don’t, specify in the JSON file reverts to the Power BI Desktop default settings.
The advantages of creating a JSON file are many. For example, you can specify that all charts use a font size of 12, that certain visuals use a particular font family, or that data labels are turned off for specific chart types. By using a JSON file, you can create a report theme file that standardizes your charts and reports, making it easy for your organization’s reports to be consistent.
