
Introduction
Basemaps are high resolution maps, designed to be printed out and used as reference for discussing and monitoring operational activities on the ground. A basemap of the area affected by the disaster is one of the most frequently requested SIMS products. Usually basemaps are among the first products that a field operation team will request from a SIMS Remote Coordinator. This tutorial will guide you through the process of making a basemap using QGIS.
What you will need
- QGIS downloaded on your computer
- QuickOSM plug-in for QGIS (follow these instructions to install)
- SIMS color palette styling file
- Basemap layer styling file
Tutorial
Prepare the workspace
Create a folder structure within the SIMS operation Dropbox basemap product folder
- Open the SIMS operation Dropbox product folder for the basemap (the naming convention will start with P, followed by a number, i.e. P01_Basemap).
- Create a folder structure within that folder to include all files required to develop and share your basemap in the SIMS community. This structure will contain folders for saving geographic layers, style files, exported images, QGIS project and others as needed.
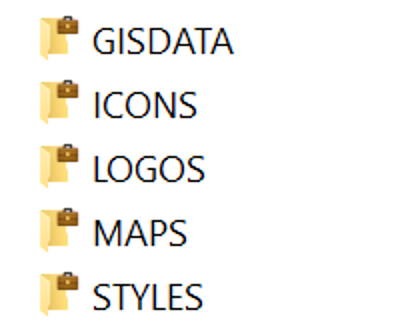
- GISDATA will contain all layers with geographic reference.
- In the GISDATA folder, more specific folders can be created for different categories of layers including the following: ADMIN, NATURE, POI, TRANSPORT, for example. This will reduce the amount of shapefile files in one folder, for more clarity and reference.
- ICONS can be used for any added SVG symbols if required.
- LOGOS contain the National Societies and IFRC logos.
- MAPS will contain image files of exported map print layouts.
- STYLES will contain all layer styles and print layouts used for base maps.
- Upload/copy the SIMS Basemap Style Files to this folder.
- Note that style files are organized into an A0 folder and an A3 folder. A0 size is used for creating large basemaps that will be printed. A3 size is more commonly used for creating a visual products or mapographics to accompany presentations, reports, or reference material.
- GISDATA will contain all layers with geographic reference.
Import the SIMS color palette to QGIS
- Follow these instructions to import the SIMS color palette to QGIS. Doing this will help your maps to maintain a consistent aesthetic by taking advantage of standardized color palettes.
Get the data
Administrative boundaries (HDX)
It is important to identify official and reliable sources for geographic data and consider their compatibility in terms of terminology, boundary definition, geographic coordination systems, and others. One of the main references in the humanitarian context is the Humanitarian Data Exchange (HDX) as a platform to exchange information across crises and organizations. Check with the IM Coordinator or field focal point if you are not sure where to find the correct administrative boundary shape files for the country/region where the operation is taking place. When a disaster hits, HDX can also make more updated layers available to download, including Open Street Map (OSM) layers.
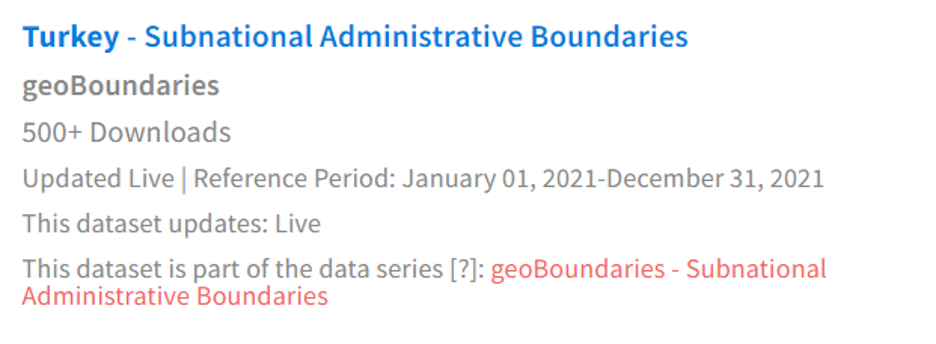
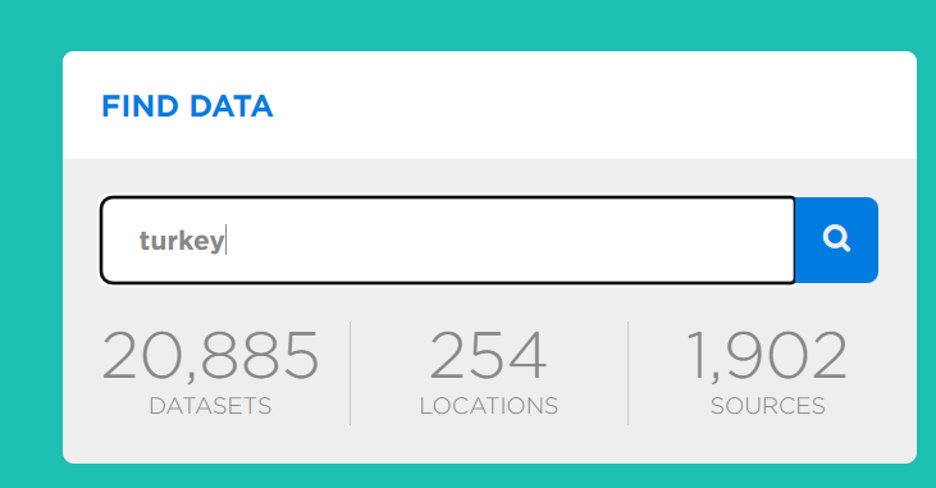
- Access HDX and type in the “Find Data” search box the name of the country to explore. In this case, “Turkey” is the input location. Scroll through the results and identity a download option for “Subnational Administrative Boundaries”. For many countries, subnational boundaries will be available at the Admin 0, Admin 1, and Admin 2 layer. If Admin 3 layer is available (the smallest administrative unit), you can also download that in case it is useful for your map later on.
- Scroll through the list and pages to find and select the layers you wish to download. Make sure to download shapefile formats (.shp).
Administrative boundaries (GeoFabrik)
If not available in HDX, another source where you can access shape files and OSM data extracts is Geofabrik. From the downloads page, you can navigate to your country of interest by selecting sub-region, country and downloading the latest shapefiles.
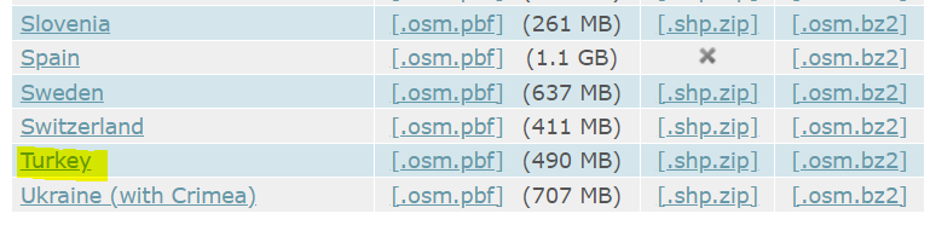
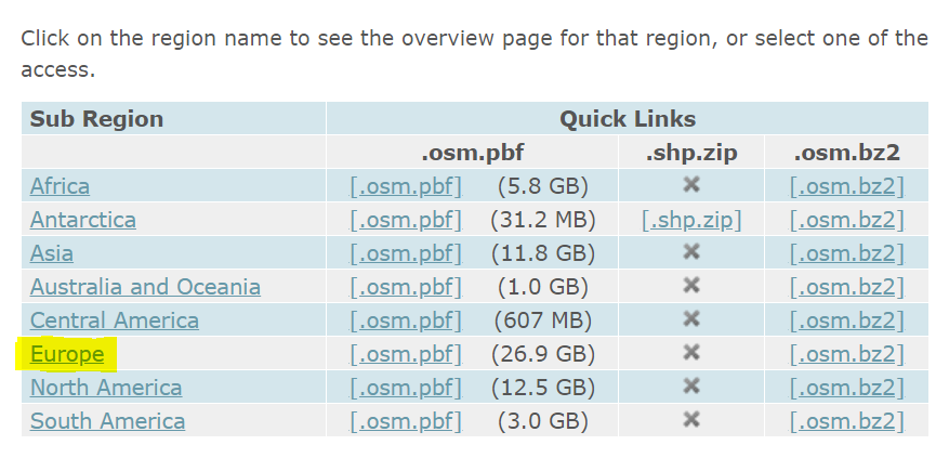
- Access Geofabrik and select the sub-region, and country you wish to download. In this case we explore Europe as sub-region.
- Scroll down through the list of countries to find Turkey, for example, and click on Turkey.
- Once in the country page, refer to commonly used formats to download zipped shapefiles. Note that the description will include the date/time of update.
Frequently used layers for basemaps
- Elements will be added onto the basemap as individual layers. Depending on the area that needs to be covered and information needed, the map can be more detailed (more layers) or less detailed. Usually, base maps can include most of these layers; check with the IM Coordinator or field focal point if they would like any additional layers:
- Administrative boundaries
- Roads (primary, secondary, and/or tertiary, depending on the level of detail required)
- Water bodies
- Points of interest/reference, such as Red Cross Red Crescent National Society office locations, hospitals, or key landmarks
- Transportation layers, including railways, ports, airports, or others that may be relevant for the operation
- Border crossing points
- Populated places (capital city, cities, towns, villages, depending on the level of detail required)
Extracting layers from Open Street Map using QGIS plug-in
HDX often has some OSM extracts available as layers, which you can download and add to your QGIS project just as you did the admin boundary levels. However, you can also use the OSM plug-in in QGIS to add these layers to your map. The OSM plug-in makes it possible to add hundreds of types of features to your maps, but you can usually start with just those listed under “Frequently used layers for basemaps”.
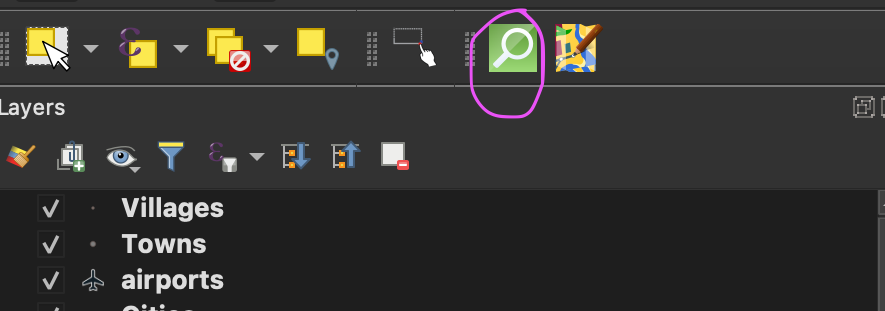
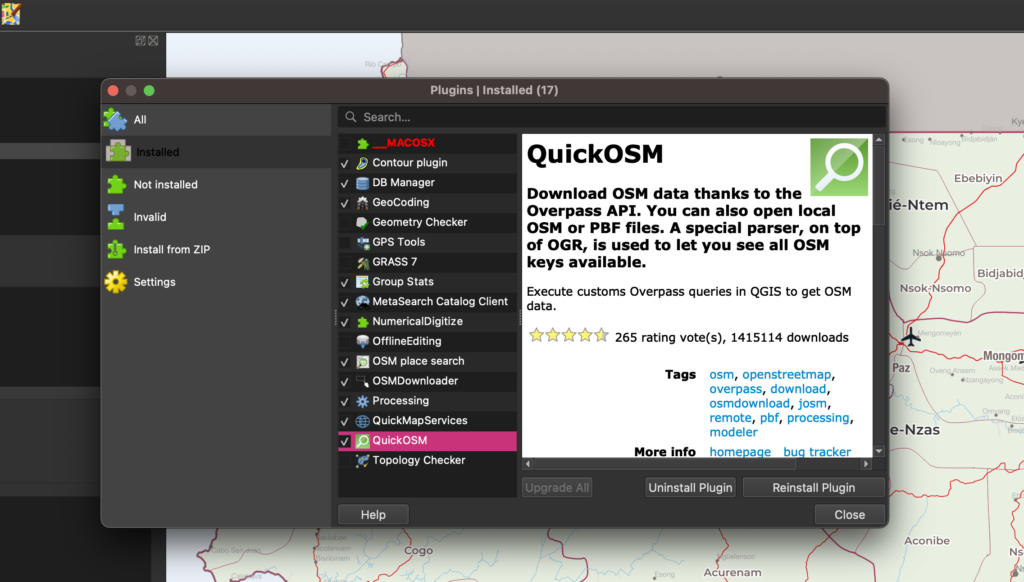
- In your QGIS window, go to “Manage and Install Plug-ins” on the menu ribbon at the top of the screen. In the box that appears, search for a plug-in called QuickOSM and install it. The QuickOSM icon will appear on one of your toolbars at the top of the screen. It looks like a white magnifying glass on a green square background.
- Click the QuickOSM icon. In the field next to Preset, type in the feature that you would like to add to your map. In the below image, for example, we typed Highways/Streets because we would like to add different types of roads to the map. If you are not sure how to describe the feature you are looking for, you can consult this list.
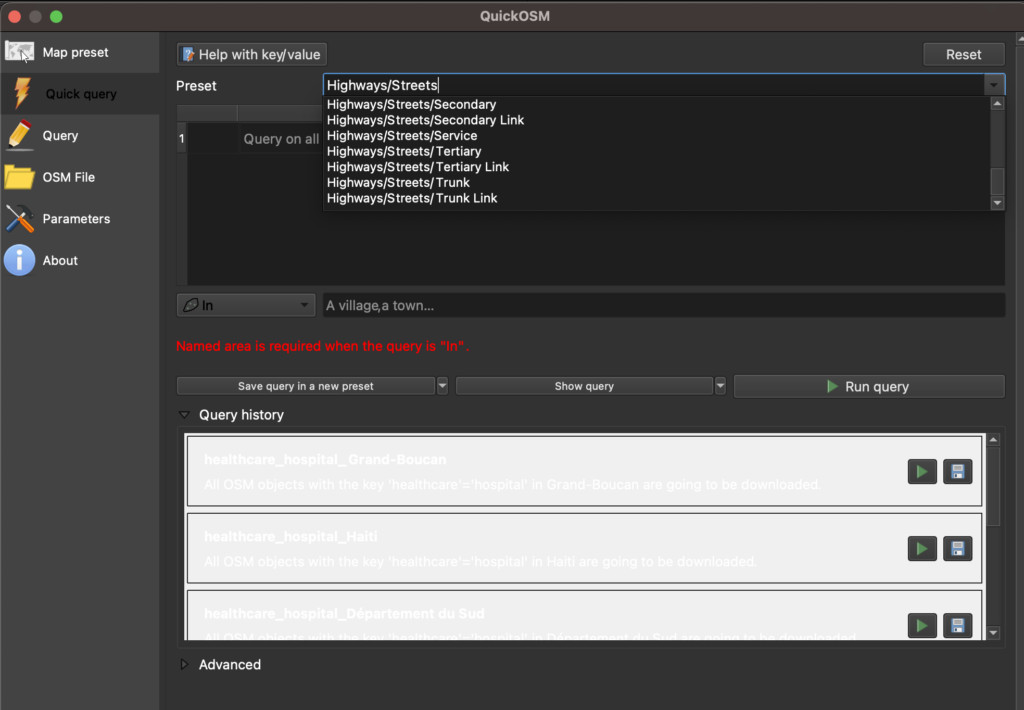
- You will see that this brings up a very long list of types of highways and street features. Usually for a basemap you can just include primary, secondary, and tertiary roads, unless you are created a map of a small area with a high level of detail. You can click the minus sign next to the features that you do not want to be included in your map. If you keep all these different features, it may slow down your query or force it to time out, and it will make your map look very busy and potentially confusing.
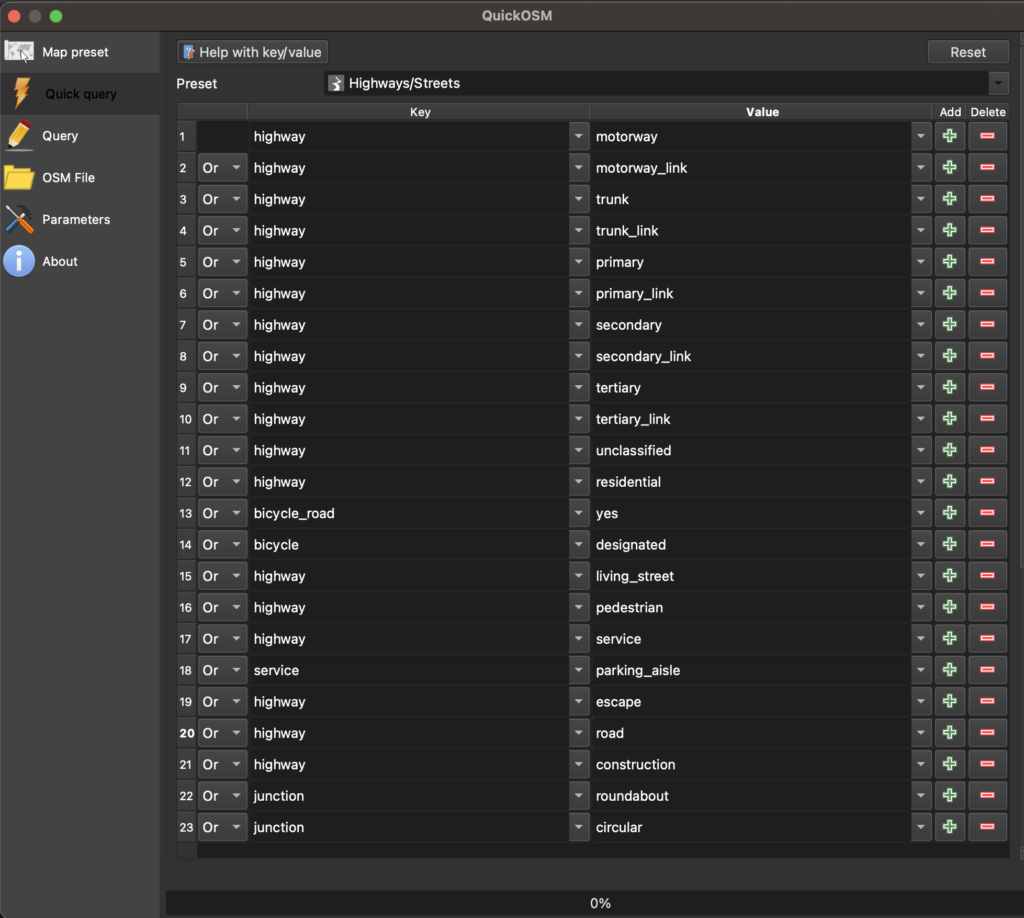
- Next to the “In” field, you can choose “Canvas Extent,” which means “only download what’s in my screen.” You may decide to set a different extent for your map depending on your needs, but you can start with “Canvas Extent” for now.
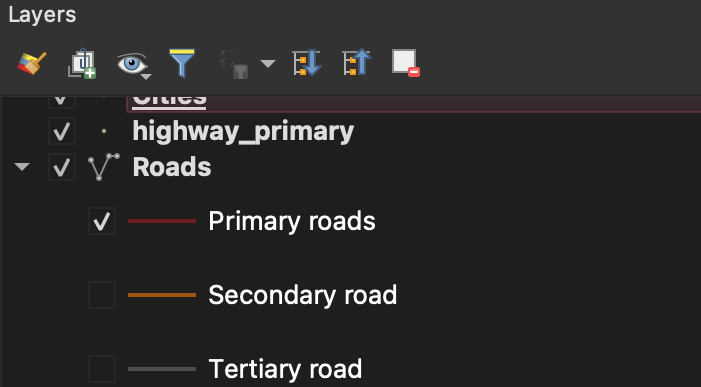
- Press the “Run query” button. If the query is successful, those layers will now appear in your layers window, as shown below.
- Repeat this process with all the remaining layers that you would like to add.
- It is important to note that these layers will only be saved as temporary layers. In order to make them permanent layers (meaning they will stay with your map project if you close your map and then reopen it again), right click on each of the layers and select “Make Permanent”. Save your layers in the GISDATA Dropbox folder you created.
Style basemap
Loading SIMS Basemap Style Files for each layer
Let’s start with the administrative boundaries layer. Turn off all layers except the administrative boundaries, using the checkboxes next to the layer name in the Layers panel. For basemaps, it is important to highlight both ADM1 and ADM2 boundaries by using polygons. Use no fill color or a light, neutral color in order to improve printing performance, as well as a neutral stroke color. ADM1 boundaries can be assigned heavier stroke width and labels than ADM2. To provide further geographic reference, add populated places as points with bold labels to rapidly locate relevant cities, villages and/or towns.
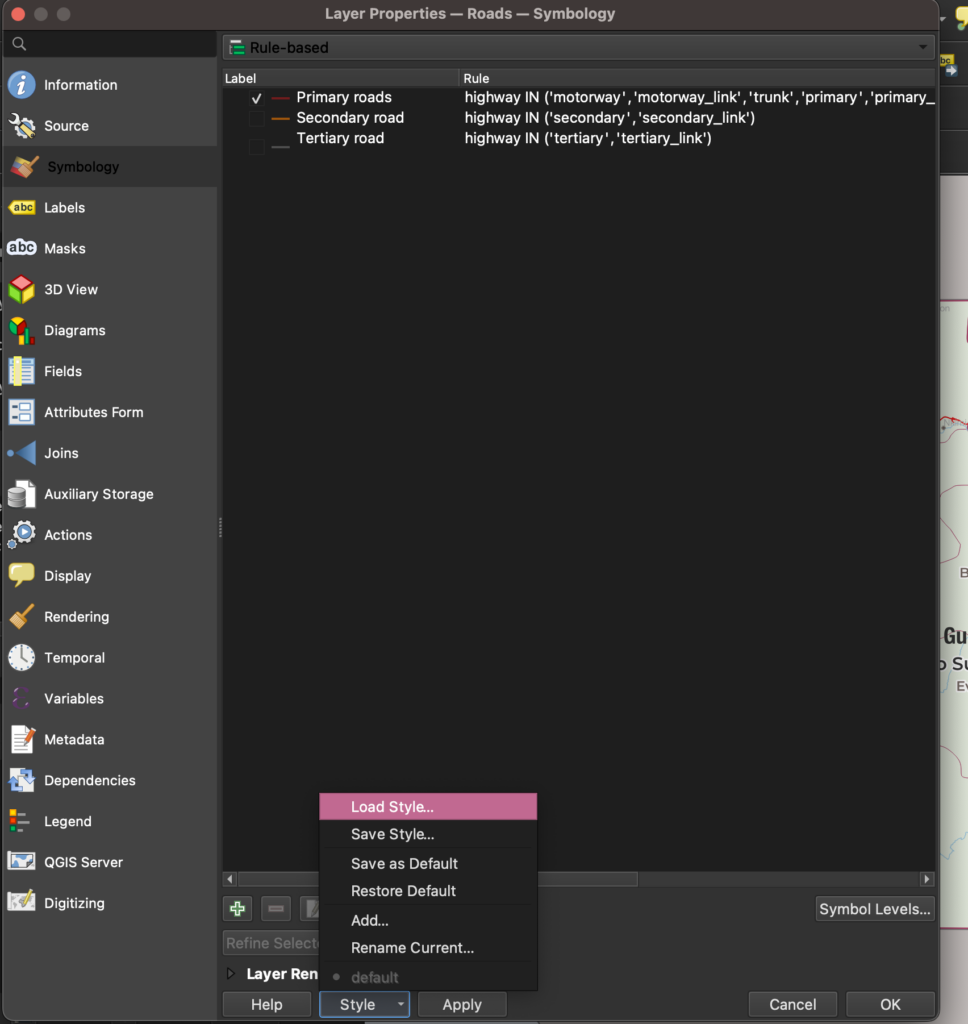
- Right click on an ADM1 boundary layer and select Properties. Then select Symbology in the box that appears. You can select the fill and stroke colors that you prefer, but we suggest using the SIMS Basemap Layer Styling File. At the bottom of the Symbology tab, you will see “Layer Rendering”. Click Style, and then “Load Style”.
- In the box that appears, click on the ellipse next to File “…”. Browse to the STYLES folder on Dropbox where you saved the SIMS Basemap Style Files. Navigate to the A0 or A3 version of the Country Borders shape file (called “A3 [or A0]_CountryBorders.qml” depending on whether your map will be in A0 or A3, and select that file.
- In the Database Styles Manager dialog box, press “Load Style” at the bottom right corner of the box.
- Now you will see the symbology for that layer is formatted to match the SIMS Basemap Style File.
- Repeat this process with the other layers that you are including on your map (i.e. highways, railways, airports, border crossings, etc.).
Preparing your map for export
When you are finished making all your necessary changes to the basemap, you can prepare it to be exported as as PDF.
Loading SIMS Layout Template
- Go to the SIMS Basemap Style Files folder, followed by the A0 or A3 folder (depending on the size that you want for your map). Then download the layout files (called QGISTemplate_A3_Portrait.qpt or QGISTemplate_A3_Landscape.qpt, depending on whether you would like a portrait or landscape orientation for your map) to your desktop or somewhere on your computer where they can be easily accessed.
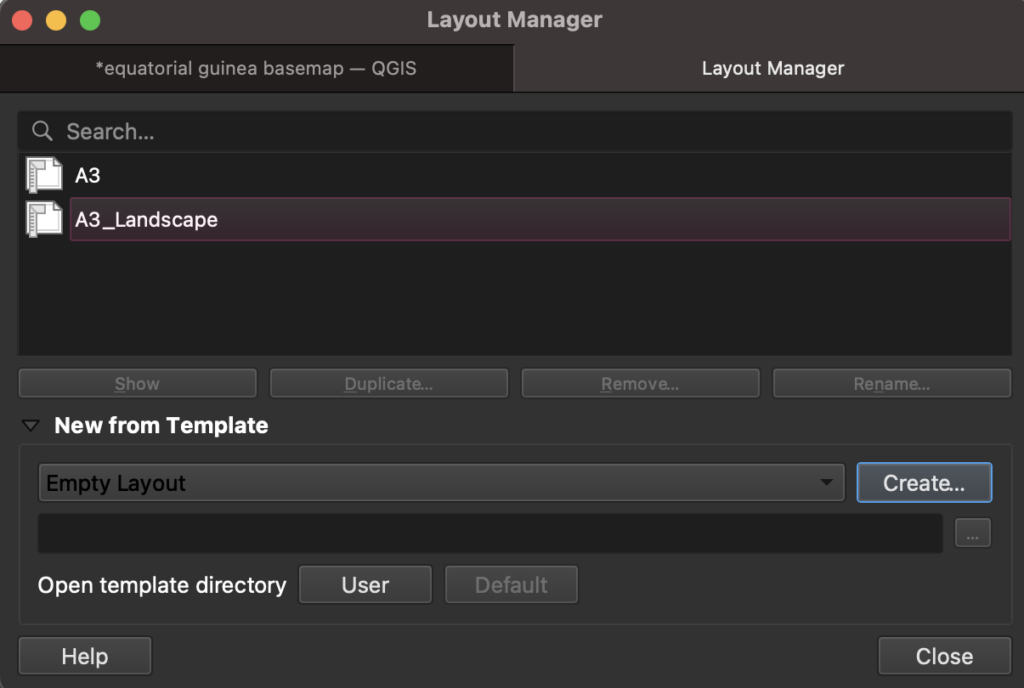
- In QGIS, click on Project from the menu at the top left of the window, followed by Layout Manager.
- In the box that appears, click on the box that says User at the bottom of the box.
- A file directory window called “composer_templates” will appear. This is the directory where QGIS stores all its layout template files. Drag and drop the .qpt layout files from your desktop into this directory. You will then see the files you added in the Layout Manager box.
- Close the Layout Manager box.
- Now, in your QGIS window, go to Project, scroll down to Layouts, and select the name of the file you just added.
Adding a legend
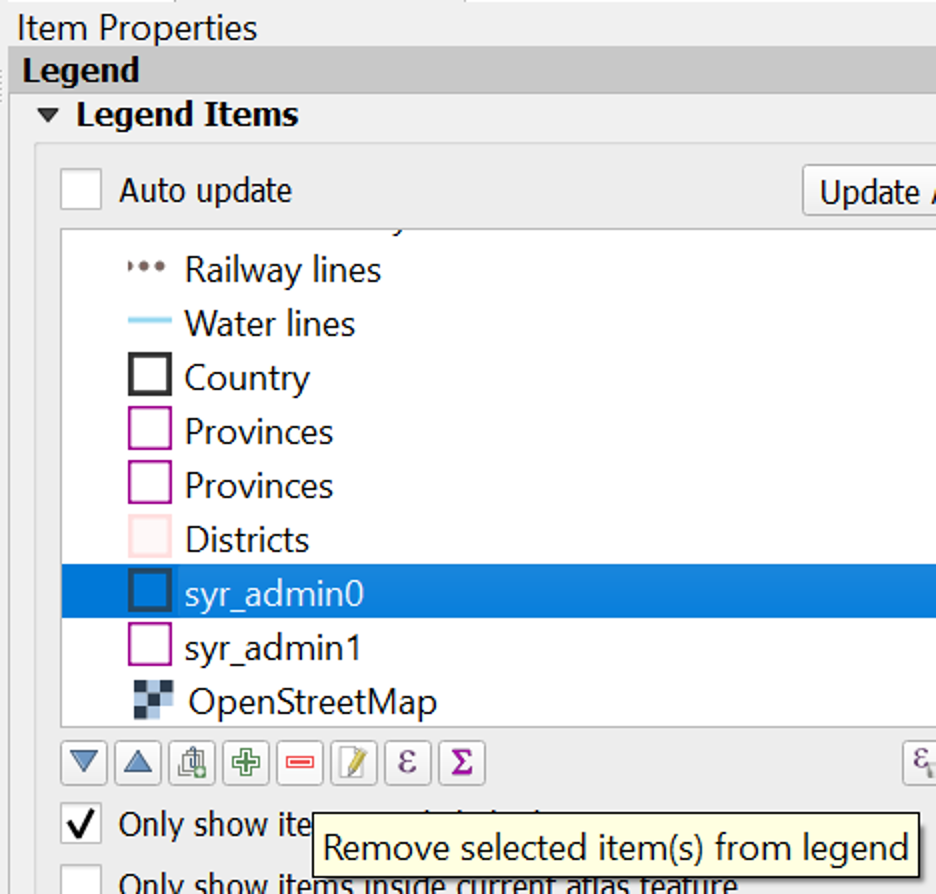
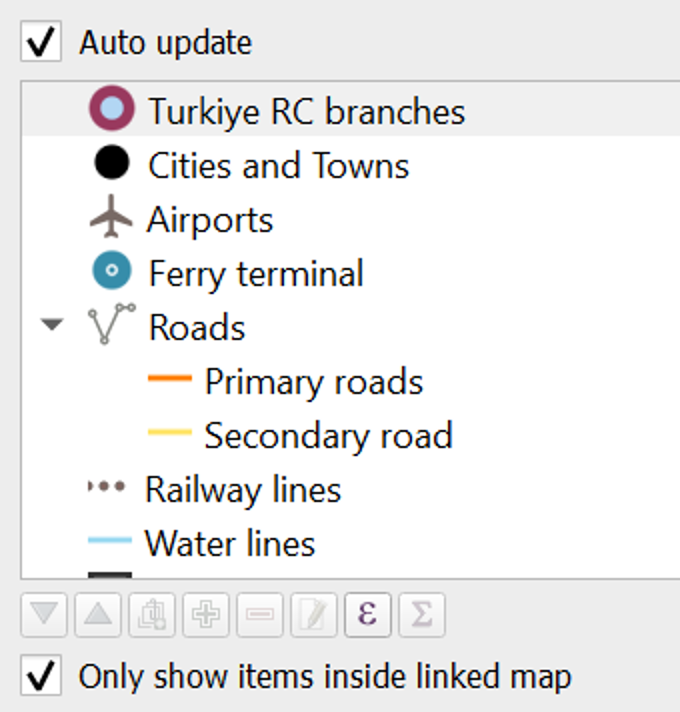
- Add or select legend item. In Item Properties select auto update and only show items inside linked map. Then uncheck Auto update to remove any extra layers that are already symbolized in legend (ADM layers for other countries/regions). Reorder layers by showing first point geometris (POIs), transport layers, and ADM layers from smallest to largest boundary (district, province, country).
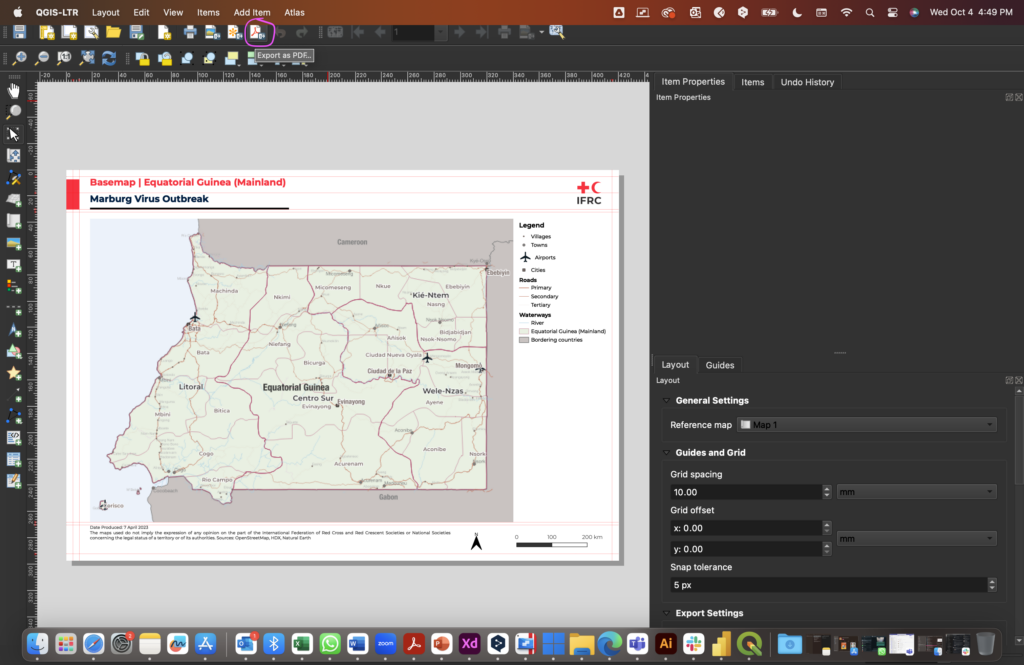
- You might choose to format the legend into more than one column so that it fits within the footer of map. In this photo for example, 4 columns are used in order to condense the layers so that they take up less space on the page.
Exporting PDF
- Click the Adobe PDF icon in the toolbar at the top of the window (circled in the image below). An export options dialog box will appear, and you can adjust your settings as needed (or keep the default settings).
- Save the PDF in the MAPS folder that you created in Dropbox. The QGIS files should be saved in the GISDATA folder that you created. Double check that all your layers are saved as permanent layers before closing your map.
BONUS: Improving performance and processing
Adding and clipping layers
When using many data layers, it is best to clip some data layers based on the area of extent you wish to explore to improve performance and processing. If a disaster impact relates to a specific region (ADM1) or municipality (ADM2), create a new shapefile that delimits only that area and name it with a reference to the region it covers. Using the Vector, Geoprocessing tools, create new clipped shapefiles for all vector layers to include in the base map. Use the previously created area of extent as overlay layer and desired layer to be clipped as input layer (ex. Roads).
- Initiate QGIS software, select “Layer” from the menu at the top of the page, then “Add Layer” and “Add Vector Layer.” Navigate to your GISDATA folder by selecting the three dots highlighted in the image. Make sure to add all required layers for developing the base map.
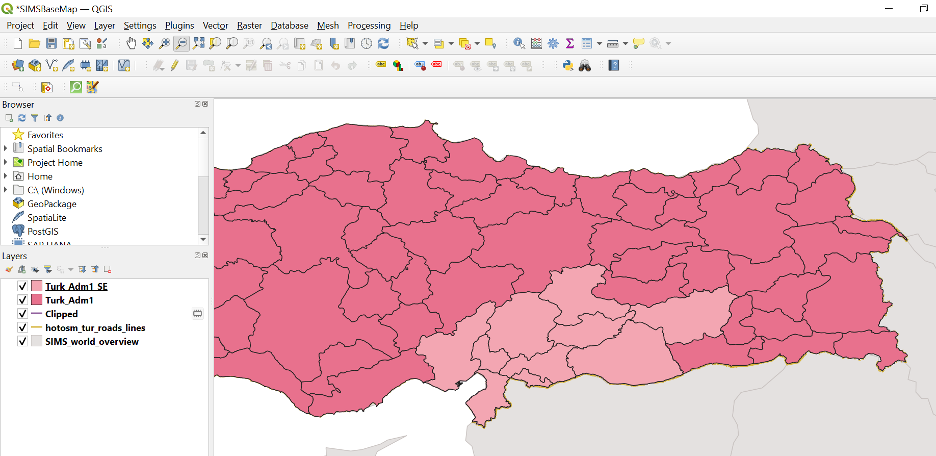
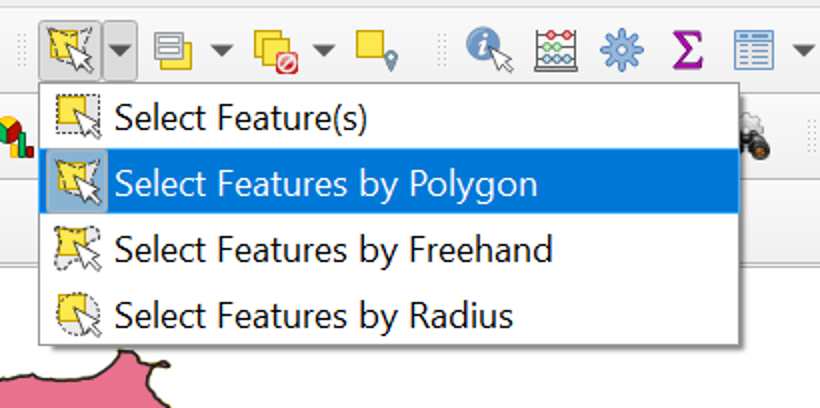
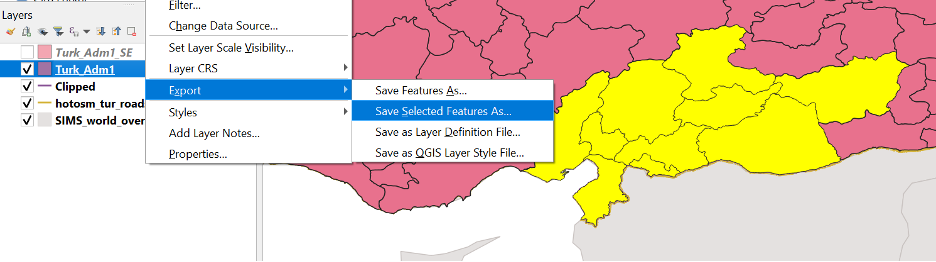
- Select and export area of extent to use as overlay layer to clip all base map layers. In this case, the ADM1 layer is selected through select feature through polygon tool. Then right click on the ADM1 layer to export only selected features as a new shapefile. Name the shapefile with a reference to the subregion, in this case “Turk_ADM1_SE” for the southeast region.
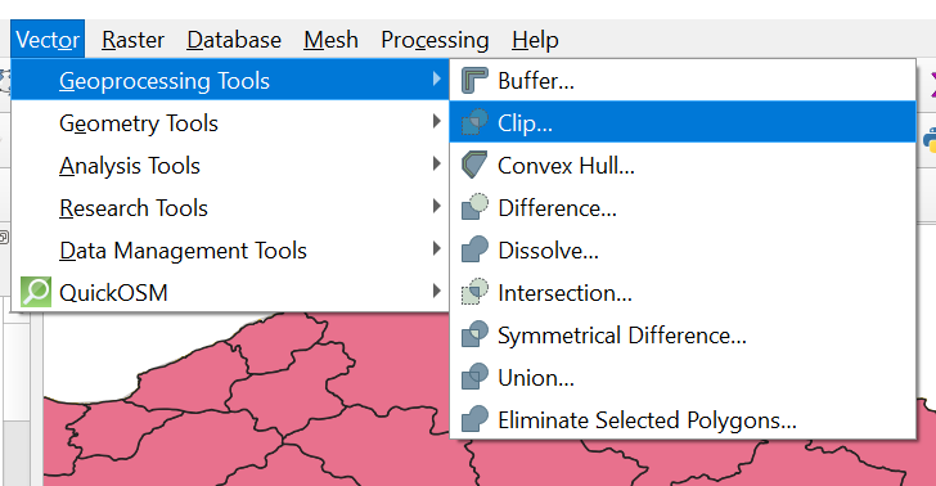
- Use the Vector, Geoprocessing Tools, Clip to create a new shapefile for roads within the Turkish southeastern region. The newly created Turk_ADM1_SE will be used as overlay layer, and hotosm_tur_roads as input layer.
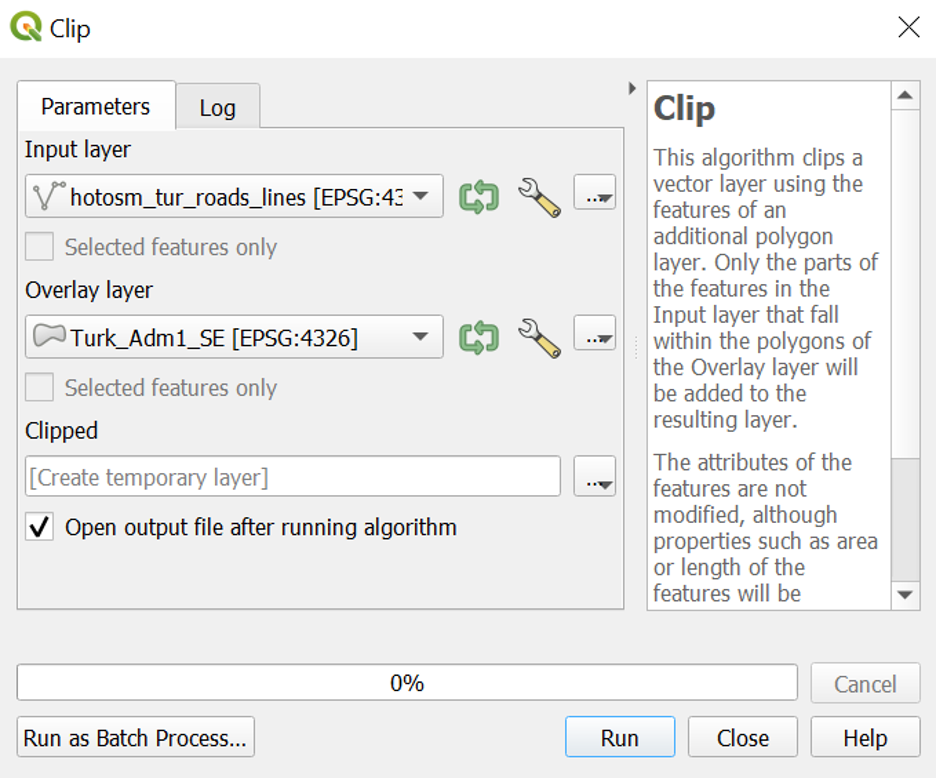
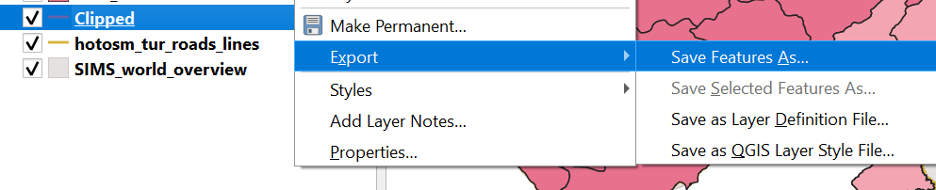
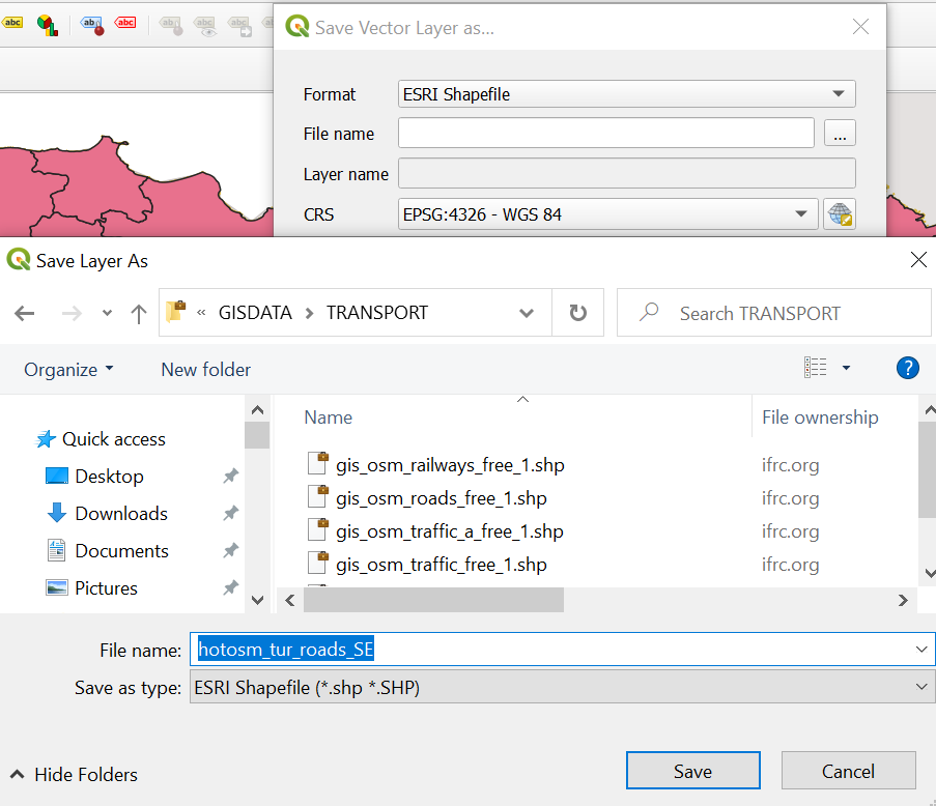
- A temporary clipped layer will be created. Make sure to export and save in the assigned TRANSPORT folder as a new shapefile, and name it with reference to source and extent, for example hotosm_tur_roads_SE.
- Repeat the same process with all layers to be included as part of the basemap including railways, waterlines, seaports, etc.
Reduce layer column size
Another way to improve performance and processing is to reduce columns from layers that are not needed for the purpose of a base map. In the case of roads for example, only columns related to osm_id, name, highway can be kept, while others can be deleted. Name will be used for labeling and highway for style classification.
1 Comment