
This guide covers how to convert a shapefile to an svg file (if the latter does not already exist), how to rename objects in an svg file using Excel so that objects have the correct geographic name, and how to add these as an editable map in Powerpoint. Using these two tools is an alternative to QGIS mapping for those who don’t have or don’t know the software. By offering the individual shapes and names of provinces and/or districts of a certain country, simple maps can be made in any operation.
Glossary
- Shapefile: vector data format for Geographic Information System software. Shapefiles consist of a number of interrelated files including:
- .
shp= feature geometry - .
dbf= attributes for each feature - .
shx= shape index format - .
prj= projection description
- .
- Scalable Vector Graphics: a vector image format for defining two- dimensional graphics – has a
svgextension - Admin levels: as different countries have different ways to describe the way their county is divided up, a universal way of describing it is admin0, admin1, admin2 etc with admin0 being the country outline, then admin1 being provinces.
Finding the Right Files
The first thing to do is download the correct shape files for the geographic area you want to map. Check Humanitarian Data Exchange and search for admin boundaries. For example: to see all the available shape files for Sudan, visit this page and download the zipped file for admin0-1 boundaries.
Search for the country and administrative level you are looking to map and download the .zip folder for it that contains the .shp, .dbf, and .prj files.
Converting Shapefiles to SVG Format
- Go to https://mapshaper.org/
- Drag and drop the .
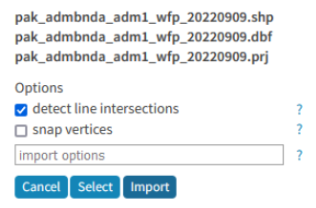
shp, .dbf& .prjfiles for your preferred admin level (e.g. all from admin 1) into https://mapshaper.org/ and click import (these files must all be added in one go (i.e. select them all in File Explorer and then drag them all in at once). ONLY copy over SHP, DBF, and PRJ. If you include all the file types you may get an error message. - We now need to establish which data field contains the geographic names that we want shown in our maps. To find these, click on the arrow on the right-hand panel and select inspect features.
Hover over the map sections, looking at the text box in the left corner. We are looking for which line shows the name we are looking for. In this example it is the Province name which is found on the line calledADM1_EN– make a note of this. - To add map labels drag and drop the same files (.
shp, .dbf& .prj) over the top of the existing map (again do this all in one go as in step 1).
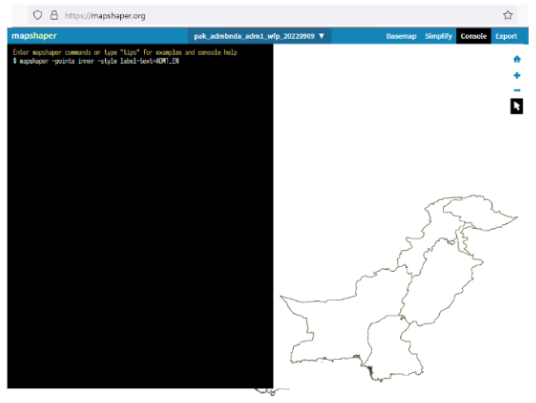
Click on the dropdown next to the filename in the top menu to check that there are now two layers. Ensure both layers are visible by clicking on the eye icon, so they go green. - To convert one of the layers to labels, open the Console from the top menu and type the following text into it: mapshaper -points inner -style label-text=ADM1_EN (replacing the text after
=with the relevant field name you copied earlier).
You will now see the polygon layer with labels. The map layer order can be changed by clicking the down arrow next to the filename in the top menu and dragging layers up/down within the dropdown box that appears. - Before exporting to SVG, ensure that the Labels layer is the uppermost layer. Click on Export in the top panel, select the
svgoption, and type id-field=ADM1_EN (replacing the text after = with the relevant field name) in the box undersvg. Select Export, click to choose your directory and navigate to an appropriate file location, name the file and click Save.
Opening Files in Excel
Importing directly into ppt would not work as all objects would be given an automated name rather than the geographical region name. We need to open the file in Excel and use some code to assign the correct region names.
- Open Excel and go to Insert > Pictures > This Device > Select the relevant
svgfrom above > Insert - The object now needs ungrouping so that each individual object is selectable – Right click > Group > Ungroup. A message will appear – select Yes
- Go to Home > Find & Select > Selection Pane.
- Select the group containing the Freeform Shapes (as opposed to the group containing the Textboxes). Go to Page Layout > Group > Ungroup. All the objects in your map should now be individually selectable but will all have a name starting with “Freeform: xxxx”.
- We now need to extract the geographical names from the
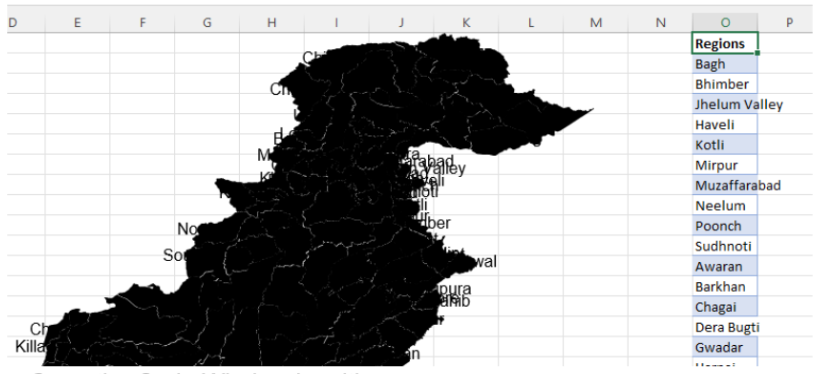
svgfile so that we can replace the “Freeform” names with the correct geographic names. Open a new sheet in Excel and go to File > Open > Browse, and change the file type to All files. Open the samesvgfile – three popup boxes will appear, select Yes, OK and OK - Scroll across the table to the id3 column, scroll down to where the placenames appear, and copy all the placenames.
- Go back to the Excel Sheet with the map on it and paste them next to the map leaving the top cell blank, and leaving one column in-between the map and the placenames. Give the field a title in row 1.
- Open the Code Window by either Pressing Alt > F11 and then selecting View > Code from the top menu, or right-clicking on the relevant worksheet tab at the bottom of the screen and selecting View Code.
- Paste the code below into the window:
Option Explicit
Sub GetShapeNames()
Dim shp As Shape
Dim i As Long
 i = 1
 For Each shp In ActiveSheet.Shapes
 ActiveSheet.Range("N1").Offset(i, 0).Value = _
 ActiveSheet.Shapes(i).Name
 i = i + 1
 Next shp
End Sub


Sub SetShapeNames()
Dim shp As Shape
Dim i As Long
 i = 1
 For Each shp In ActiveSheet.Shapes
 ActiveSheet.Shapes(i).Name = _
 ActiveSheet.Range("O1").Offset(i, 0).Value
 i = i + 1
 Next shp
End Sub
The first part of the code gets the shape names from the map objects and the second part changes these names to the geographical region names based on the ones that you pasted into the spreadsheet in step 6. Therefore, the first part of the code should reference the column to the left of the pasted placenames (in this case column N), and the second part should reference the column containing the pasted placenames (in this case column O) – change N1 and O1 (highlighted in red above) in the code above to represent the correct columns.
- Once the code is pasted into the code window. Make sure the cursor is in the top section of code and then click the play button in the top menu bar. Then move the cursor to the bottom part of the code and click the play button again. If a RuntimeError appears, just click OK – it should still have worked.
- Click on one of the polygons – the geographical name should appear in the box on the top left. Do several checks to ensure that the correct geographic names have been assigned to the correct objects/polygons. If there is a mismatch, ensure that there are as many placenames as there are polygons/objects.
Copying the Data into PowerPoint
- Select all the polygon and label data from Excel by selecting Home > Find & Select > Select Objects and then drag the cursor over the entire map – open the Selection Pane (Home > Find & Select > Selection Pane) to ensure that all items have been selected (all should be highlighted as shown on the right). If any are not highlighted, press
Ctrland click on the missing ones. - Select Copy, Open PowerPoint and paste the objects into the Powerpoint. If the copied map is too big for the
pptscreen, go back to Excel, select all (Find & Select > Select Objects > Drag a polygon around all the objects) > Group, reduce the map size (Right click the map, select Size and Properties and then tick Lock Aspect Ratio. Then use the%boxes to alter the size), copy topptand then ungroup. - Open the Selection Pane in PowerPoint – Home > Select > Selection Pane and change the name of the Labels group from Graphic to Labels by clicking twice on the group title and typing in the new name.
- To change the color of the polygons click & drag the cursor to create a rectangle over the map to select all objects. Unselect the labels by holding down Ctrl and clicking on the ‘Labels’ title in the Selection Pane
- Click on Home > Shape Fill and select White, click on Shape Outline and select Black