
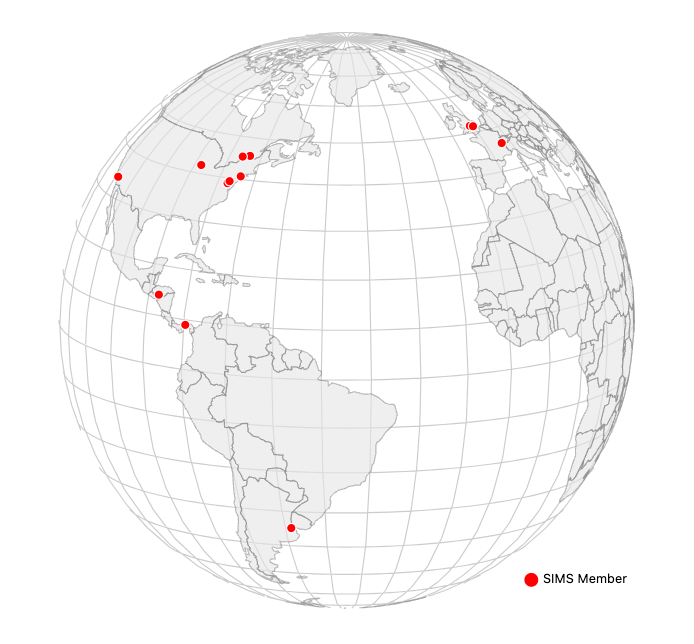
The landing page of the SIMS Portal features a D3.js visualization of a spinning globe with point markers that represent the locations of active members around the world. This walkthrough explains the various elements of the JavaScript that ingests data from the Portal’s database and plots the points.
D3.js Introduction
D3 is a JavaScript library for creating interactive and dynamic data visualizations on the web. Though extremely powerful and versatile, D3 has also gained a reputation for having a steep learning curve for beginners. With patience (and plenty of documentation), you can learn the most important elements to building these sorts of visualizations.
It’s useful to have at least a general familiarity with HTML, as D3 is essentially editing page elements on the fly by binding data to the Document Object Model (DOM).
There are a number of free resources available on the internet if this is an area that you’re interested in. I recommend exploring Observable, which features a number of great examples and tutorials that break down the steps required for recreating them.
Script Walkthrough
You can find the whole script here on GitHub. Here it is for reference as we walk through each step:
const width = 750;
const height = 750;
const config = {
	speed: 0.01,
	verticalTilt: -12,
	horizontalTilt: 0
};
let locations = [];
const svg = d3.select('svg').attr('width', width).attr('height', height);
const markerGroup = svg.append('g');
const projection = d3.geoOrthographic().translate([width / 2, height / 2]);
const initialScale = projection.scale();
const path = d3.geoPath().projection(projection);
const center = [width / 2, height / 2];

drawGlobe();
drawGraticule();
enableRotation();

function drawGlobe() {
	d3.queue()
	.defer(d3.json, '/static/data/world-110m.json')
	.defer(d3.json, '/static/data/locations.json')
	.await((error, worldData, locationData) => {
		svg.selectAll('.segment')
		.data(topojson.feature(worldData, worldData.objects.countries).features)
		.enter().append('path')
		.attr('class', 'segment')
		.attr('d', path)
		.style('stroke', '#888')
		.style('stroke-width', '1px')
		.style('fill', (d, i) => '#e5e5e5')
		.style('opacity', '.6');
		locations = locationData;
		drawMarkers();
	});
}

function drawGraticule() {
	const graticule = d3.geoGraticule()
	.step([10, 10]);

	svg.append('path')
	.datum(graticule)
	.attr('class', 'graticule')
	.attr('d', path)
	.style('fill', '#fff')
	.style('stroke', '#ccc');
}

function enableRotation() {
	d3.timer(function (elapsed) {
	projection.rotate([config.speed * elapsed - 10, config.verticalTilt, config.horizontalTilt]);
	svg.selectAll('path').attr('d', path);
	drawMarkers();
	});
}

function drawMarkers() {
	const markers = markerGroup.selectAll('circle')
	.data(locations);

	markers.enter()
	.append('circle')
	.merge(markers)
	.attr('cx', d => projection([d.longitude, d.latitude])[0])
		.attr('cy', d => projection([d.longitude, d.latitude])[1])
	.attr('fill', d => {
		const coordinate = [d.longitude, d.latitude];
		const gdistance = d3.geoDistance(coordinate, projection.invert(center));
		return gdistance > 1.5 ? 'none' : 'red';
	})
	.attr('stroke', d => {
		const coordinate = [d.longitude, d.latitude];
		const gdistance = d3.geoDistance(coordinate, projection.invert(center));
		return gdistance > 1.5 ? 'none' : 'white';
	})
	.attr('r', 4);

	markerGroup.each(function () {
	this.parentNode.appendChild(this);
	});
}

svg.append('circle').attr('cx', 535).attr('cy', 600).attr('r', 6).style('fill', 'red');
svg.append('text').attr('x', 545).attr('y', 600).text('SIMS Member').style('font-size', '11px').attr('alignment-baseline', 'middle');
Set Up Constants
const width = 750;
const height = 750;
const config = {
  speed: 0.01,
  verticalTilt: -12,
  horizontalTilt: 0
};
In lines 1 and 2, we establish the shape of the canvas that will hold the globe. Then we create a dictionary in line 3 to establish the speed at which the globe spins, how far forward it is tilted, and how much to tip it to the side.
Initialize Data and Establish SVG
let locations = [];
const svg = d3.select('svg').attr('width', width).attr('height', height);
Line 1 initializes an empty array which will hold the data for the locations on the globe. Line 2 creates the SVG element, which is the frame where we will embed the visualization in the webpage. The .select('svg') tells the script to attach this visualization there. While not included in this JavaScript, this is simply an HTML <svg></svg> where you want to see this. The .attr() references the constants we established earlier to set the height and width.
Projection Setup
const markerGroup = svg.append('g');
const projection = d3.geoOrthographic().translate([width / 2, height / 2]);
const initialScale = projection.scale();
const path = d3.geoPath().projection(projection);
const center = [width / 2, height / 2];markerGroup: A group element that will hold the markers to be added to the globe.projection: This sets up a geographic orthographic projection for the globe and translates it to the center of the SVG canvas.initialScale: The initial scale of the projection, which will be used for zooming purposes.path: A path generator that will convert geographic data into SVG path data based on the specified projection.center: The center of the SVG canvas, used for some calculations. The points have to spin along with the globe, and we use the center as a way to create a fixed reference point.
drawGlobe() Function
function drawGlobe() {
  d3.queue()
  .defer(d3.json, '/static/data/world-110m.json')
  .defer(d3.json, '/static/data/locations.json')
  .await((error, worldData, locationData) => {
    // Code to draw the globe's countries
    // ...
    locations = locationData;
    drawMarkers();
  });
}d3.queue(): This function from the D3 library creates a queue that allows loading multiple files asynchronously. In this case, it loads two JSON files:world-110m.json(which contains data about world countries’ outlines) andlocations.json(which contains data about specific locations and their coordinates)..defer(d3.json, '/static/data/world-110m.json'): This line defers the loading ofworld-110m.json. This is a standard file used by many geospatial D3 visualizations, and can be found here..defer(d3.json, '/static/data/locations.json'): This line defers the loading oflocations.json. On the SIMS Portal, these two files are hosted in the local filesystem. When a user updates their location, a helper function updates thelocations.jsonfile. That file is structured like this:[{"latitude": 48.858705, "longitude": 2.342865}], with each additional point as another dictionary in the list..await((error, worldData, locationData) => {...}): This function is called when both files are loaded. It receiveserror(if any),worldData, andlocationDataas arguments. It processes the loaded data and then calls thedrawMarkers()function.
drawGraticule() Function
function drawGraticule() {
  const graticule = d3.geoGraticule()
    .step([10, 10]);

  svg.append('path')
    .datum(graticule)
    .attr('class', 'graticule')
    .attr('d', path)
    .style('fill', '#fff')
    .style('stroke', '#ccc');
}d3.geoGraticule(): This function creates a new graticule generator that generates lines of longitude and latitude at regular intervals. Graticules are the longitude and latitude lines overlaid over the basemap..step([10, 10]): This line sets the step interval for the graticule. In this case, it generates lines every 10 degrees of longitude and latitude.svg.append('path'): This adds a new path element to the SVG canvas, which will represent the graticule..datum(graticule): This sets the data for the path element to be the generated graticule data..attr('class', 'graticule'): This assigns the class “graticule” to the path element. As mentioned above, D3 manipulates the DOM on the webpage, and by using.attr()here, we’re assigning a specific CSS class to the element..attr('d', path): This sets the “d” attribute of the path element, which defines the path data based on the specified projection (path)..style('fill', '#fff'): This sets the fill color of the graticule to white..style('stroke', '#ccc'): This sets the stroke color of the graticule lines to light gray.
enableRotation() Function
function enableRotation() {
  d3.timer(function (elapsed) {
    projection.rotate([config.speed * elapsed - 10, config.verticalTilt, config.horizontalTilt]);
    svg.selectAll('path').attr('d', path);
    drawMarkers();
  });
}d3.timer(): This function from D3 sets up a timer that repeatedly calls the provided callback function. The callback function receives the elapsed time in milliseconds as its argument.projection.rotate(): This line updates the rotation angles of the globe’s projection based on the elapsed time and the values from theconfigobject. It sets the new rotation based on the formula[config.speed * elapsed - 10, config.verticalTilt, config.horizontalTilt]. Note that all of these are constants we established earlier in the script.svg.selectAll('path').attr('d', path): This line updates all the path elements on the SVG canvas with new path data based on the updated projection.drawMarkers(): This function is called withinenableRotation()to update the positions of the markers on the globe.
drawMarkers() Function
function drawMarkers() {
  const markers = markerGroup.selectAll('circle')
    .data(locations);

  markers.enter()
    .append('circle')
    .merge(markers)
    .attr('cx', d => projection([d.longitude, d.latitude])[0])
    .attr('cy', d => projection([d.longitude, d.latitude])[1])
    .attr('fill', d => {
         const coordinate = [d.longitude, d.latitude];
         const gdistance = d3.geoDistance(coordinate, projection.invert(center));
         return gdistance > 1.5 ? 'none' : 'red';
    })
    .attr('stroke', d => {
         const coordinate = [d.longitude, d.latitude];
         const gdistance = d3.geoDistance(coordinate, projection.invert(center));
         return gdistance > 1.5 ? 'none' : 'white';
    })
    .attr('r', 4);

  markerGroup.each(function () {
    this.parentNode.appendChild(this);
  });
}
markerGroup.selectAll('circle'): This selects all existing circle elements within themarkerGroup..data(locations): This binds thelocationsarray to the selected circles. It associates each location in the array with a circle element (or creates new circles if needed).markers.enter().append('circle'): This creates new circle elements for any locations in the data that don’t have a corresponding circle yet..merge(markers): This merges the newly created circles with the existing ones to handle updates to the data and ensure all circles are up-to-date..attr('cx', d => projection([d.longitude, d.latitude])[0]): This sets the “cx” attribute of each circle to the x-coordinate (in pixel space) of the location’s longitude and latitude projected onto the SVG canvas. The[0]refers to the first element in the data, and the next.attr()will reference the second—remember, in JavaScript (and many programming languages), indexing starts at zero..attr('cy', d => projection([d.longitude, d.latitude])[1]): This sets the “cy” attribute of each circle to the y-coordinate (in pixel space) of the location’s longitude and latitude projected onto the SVG canvas..attr('fill', d => { ... }): This sets the fill color of the circle based on some condition related to its distance from the center of the globe. Thecoordinateline nested inside of this creates an array calledcoordinatecontaining the longitude and latitude of the current marker. d.longitude and d.latitude are properties of the data object (d) that specify the geographic coordinates of the marker. Thegdistanceline calculates the geographic distance (in radians) between the current marker’s position (coordinate) and the center of the globe (projection.invert(center)).d3.geoDistanceis a D3.js function that calculates the great-circle distance between two geographic coordinates..attr('stroke', d => { ... }): This sets the stroke color of the circle based on the same condition as the fill color. Thecoordinateandgdistancelines nested in here are doing the same thing as above, just for the stroke instead of the fill..attr('r', 4): This sets the radius of each circle to 4 pixels.markerGroup.each(function () { this.parentNode.appendChild(this); }): This ensures that the marker group is brought to the front of the SVG, so the markers appear above the globe.
Create Legend
svg.append('circle').attr('cx', 535).attr('cy', 600).attr('r', 6).style('fill', 'red');
svg.append('text').attr('x', 545).attr('y', 600).text('SIMS Member').style('font-size', '11px').attr('alignment-baseline', 'middle');
The first line adds the red circle to the legend. The cx and cy refer to coordinates in the visualization, and 6 refers to the size of the circle itself. Line two does the same thing, but with the SIMS Member label. Notice that we’re using the coordinate grid to set it at the same height (y value), but moving it over 10 pixels (535 versus 545).
Embedding the D3 Visualization on a Webpage
Now that we’ve developed the script itself, we need to place it into the HTML. There are two things we need to do to make that happen.
Create Placeholder SVG
As mentioned above, the script itself needs to point to an SVG container. It can be as simple as <svg></svg>. In the case of the SIMS Portal, I needed to do a bit more to make it appear as it does:
The viewBox is an attribute in SVGs that define coordinate grids for canvases. The four numbers you see refer to tweaks I had to do to make the canvas position the globe correctly. In your own use cases, you’ll likely just need to experiment manually to get your own visualizations to fit correctly. Those numbers in order are:
min-x: The minimum x-coordinate of the viewBox.min-y: The minimum y-coordinate of the viewBox.width: The width of the viewBox.height: The height of the viewBox.
When preserveAspectRatio="none", it means that the aspect ratio of the viewBox will not be preserved when scaling the content to fit the available space in the SVG canvas. In other words, the content will be stretched or compressed in both the horizontal and vertical directions to fill the entire SVG canvas, which can lead to the content appearing distorted if the viewBox and the SVG canvas have different aspect ratios. Since we established a square canvas, we don’t need to worry about distortion.
Import D3 Library
The script above won’t do anything without connecting to the D3 library. In your own web development use cases, you have two options for building that connection. You can either download D3 in its entirety and reference it locally, or you can use a CDN to import it each time the page loads. We’re utilizing the latter strategy.
This visualization uses both the standard D3 library as well as a subset of D3 called TopoJSON.
<script src="https://d3js.org/d3.v4.min.js"></script>
<script src="https://d3js.org/topojson.v1.min.js"></script>
Since a browser will read HTML from top to bottom, these lines need to go before your script. That means when you put all of these pieces together on your HTML file, it will look like this:
<svg viewBox="0 120 650 650" preserveAspectRatio="none"></svg>
<script src="https://d3js.org/d3.v4.min.js"></script>
<script src="https://d3js.org/topojson.v1.min.js"></script>
<script>
    const width = 750;

    // the rest of the script here...

	svg.append('text').attr('x', 545).attr('y', 600).text('SIMS Member').style('font-size', '11px').attr('alignment-baseline', 'middle');
</script>